Array layout is one of the core achievements in the design of photovoltaic power stations and the important part of the refined design of photovoltaics. Statistical analysis of the final arranged arrays can be used to check whether the results are reasonable and also provides a reference for the optimization of design results.Candela3D provides users with the following statistical analysis capabilities:
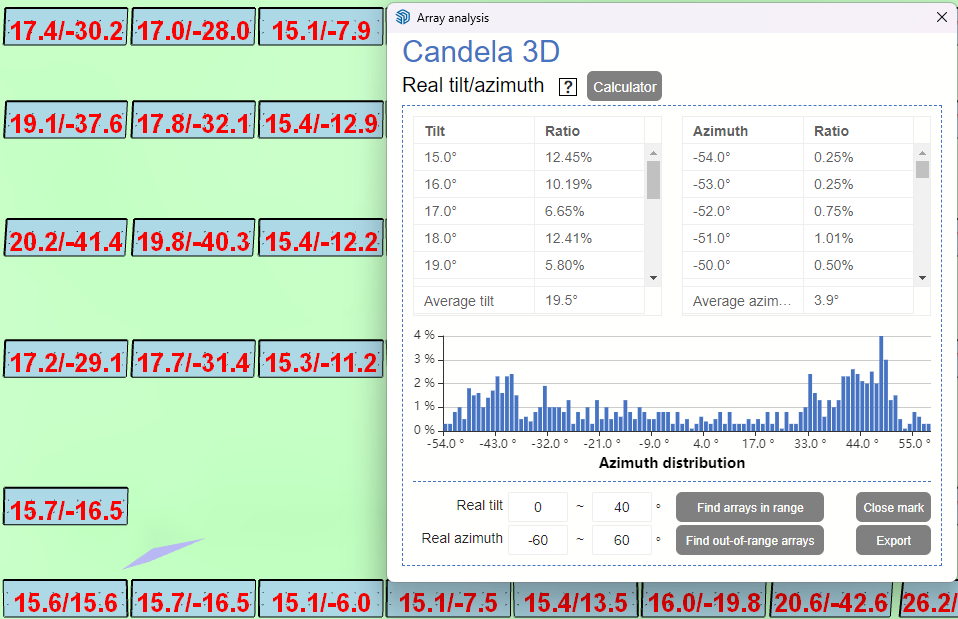
1. Array real tilt/azimuth
The actual tilt/azimuth is relative to the nominal tilt/azimuth, mainly for complex terrains. Since no site leveling is performed, the long side of the array no longer remains horizontal, resulting in changes in the actual orientation of the array. For details, see the article "Are You Really Thoroughly Understanding the Familiar Tilt and Azimuth?".
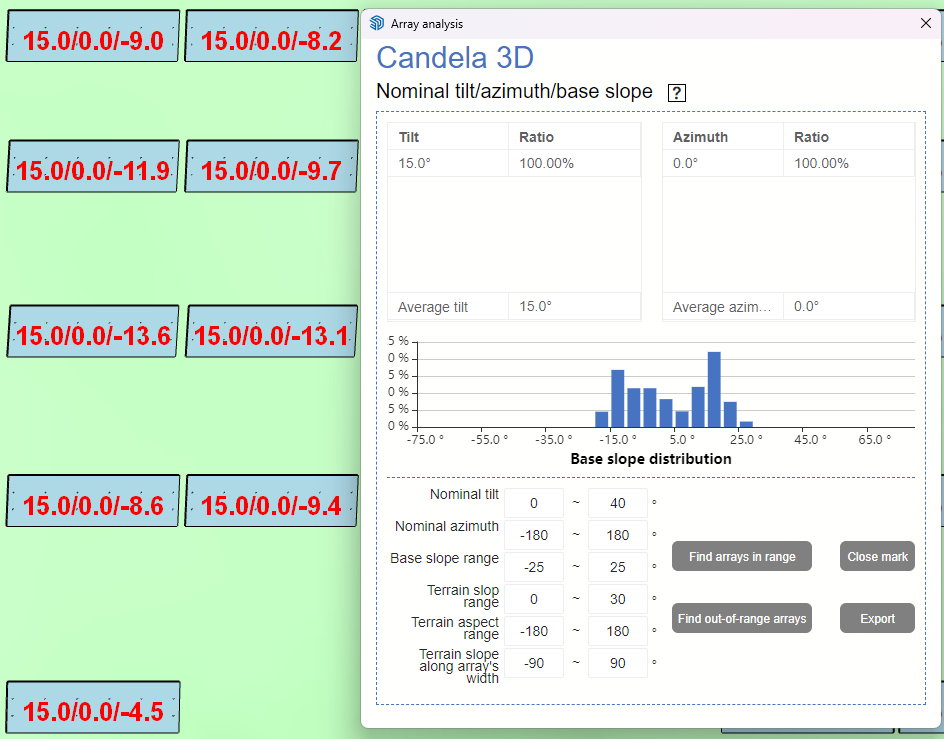
2. Array nominal tilt/azimuth/base slope
The nominal tilt/azimuth refers to the tilt and azimuth set during the layout. When the ground on which the arrays are located is horizontal, the real tilt/azimuth equals the nominal tilt/azimuth, and at this time, the base slope of the arrays is 0°. When the ground on which the arrays are located is not horizontal, the base slope of the arrays is not equal to 0°.
3. Array type statistics
It is primarily used for the statistics of different types of arrays, allowing for the statistics of all, selected, or by PV zone.
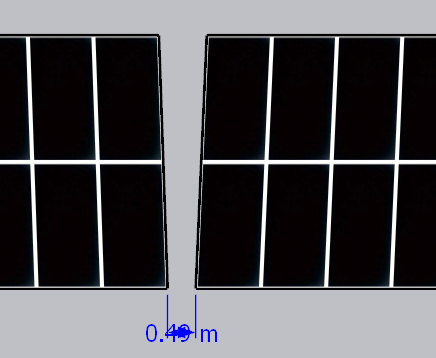
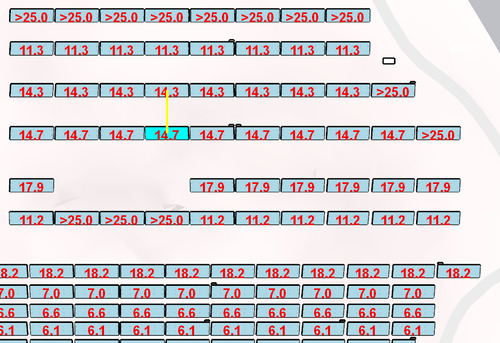
4. Array pitch statistics
Pitch Statistics can calculate and display the row spacing and net spacing of each square matrix, and can search for square matrices within a specified pitch range, exporting the pitch data of the square matrices.

5. Array Statistics Table
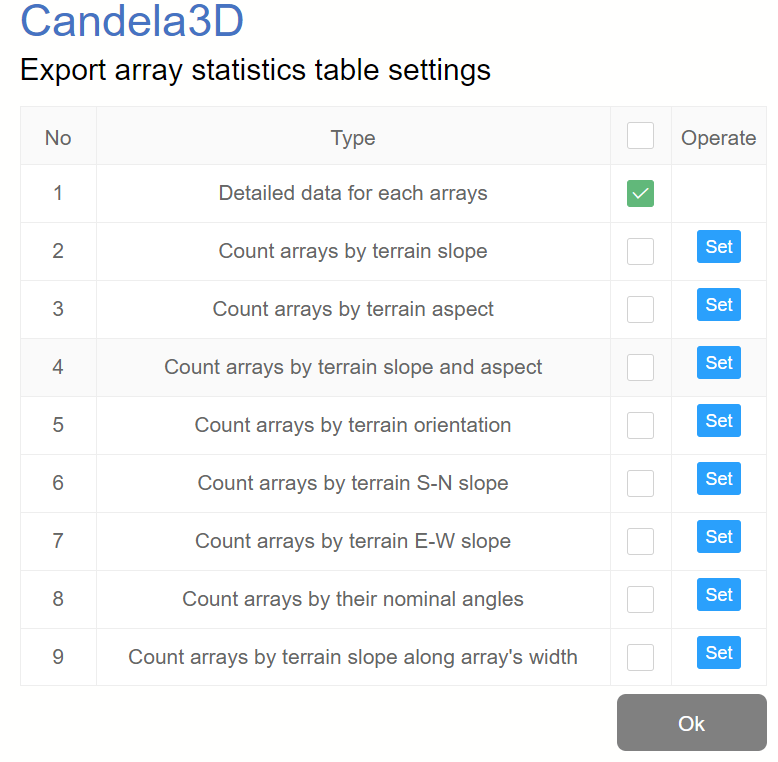
1) Detailed data for each arrays
Display detailed information for each array from 19 dimensions.

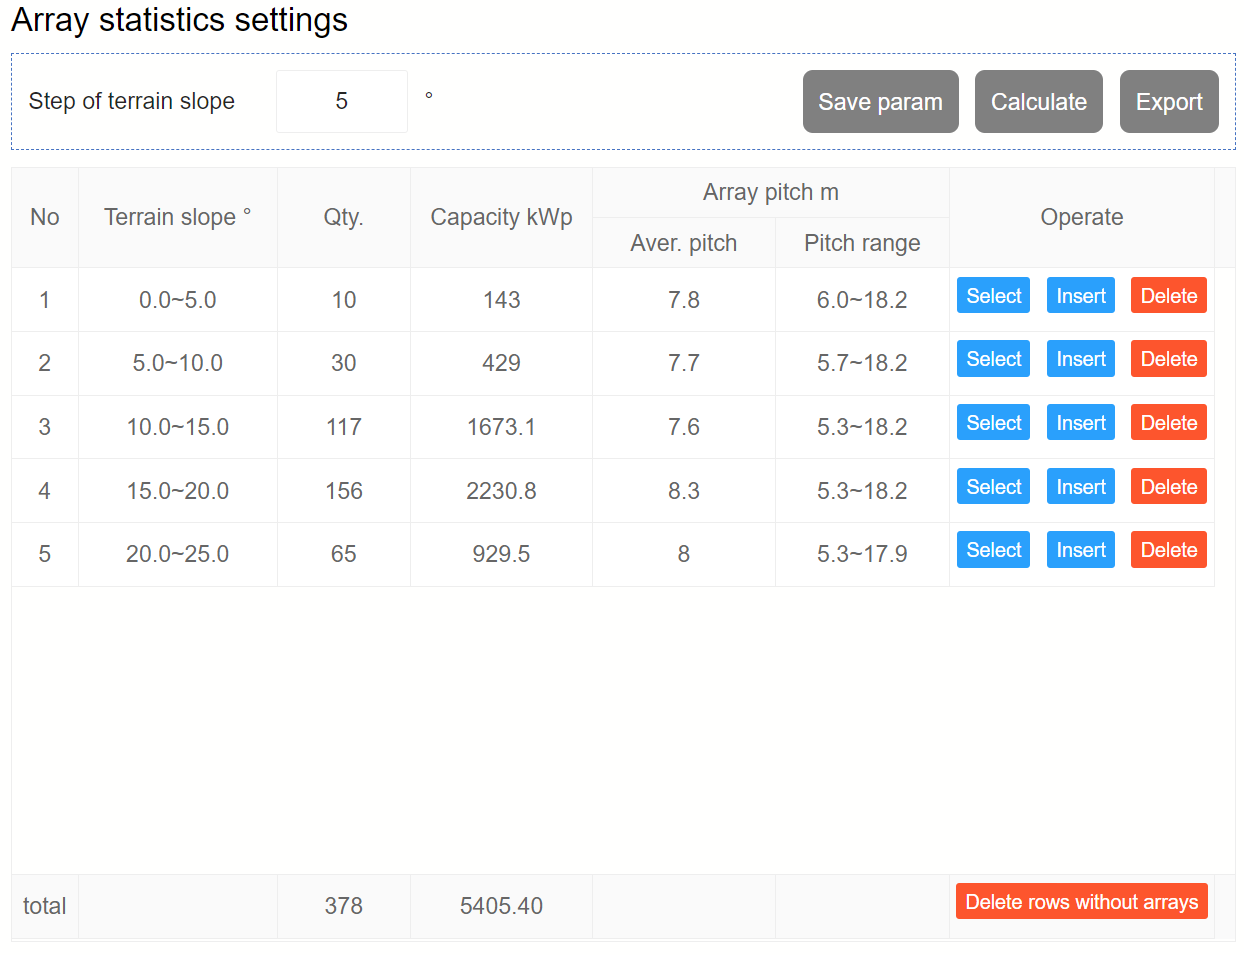
2) by terrain slope
3) by terrain aspect

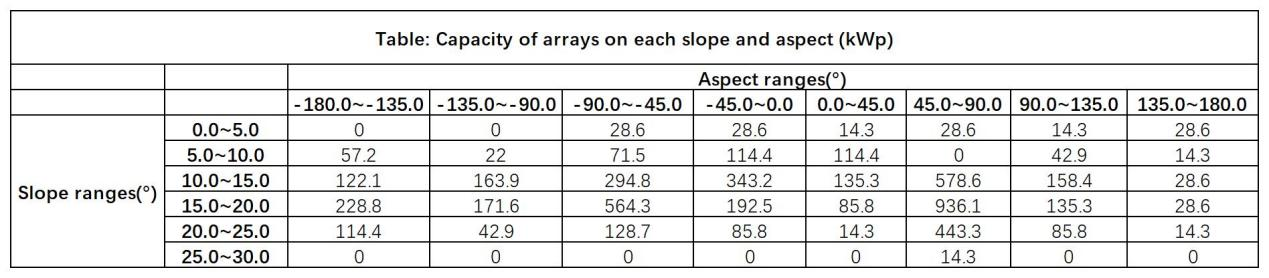
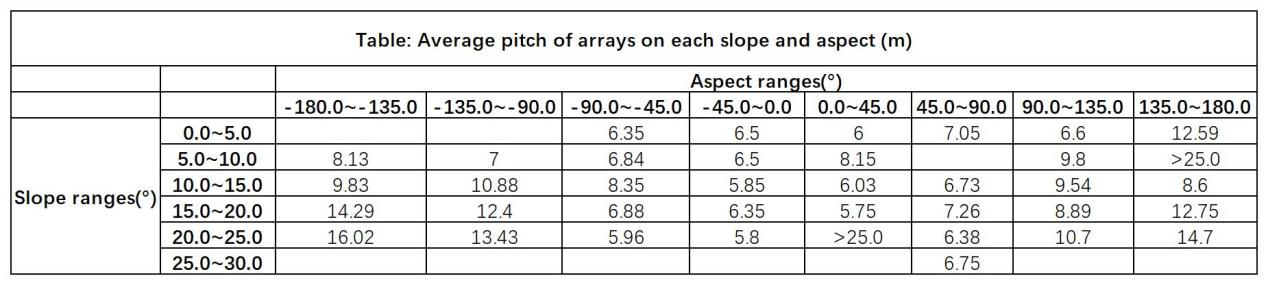
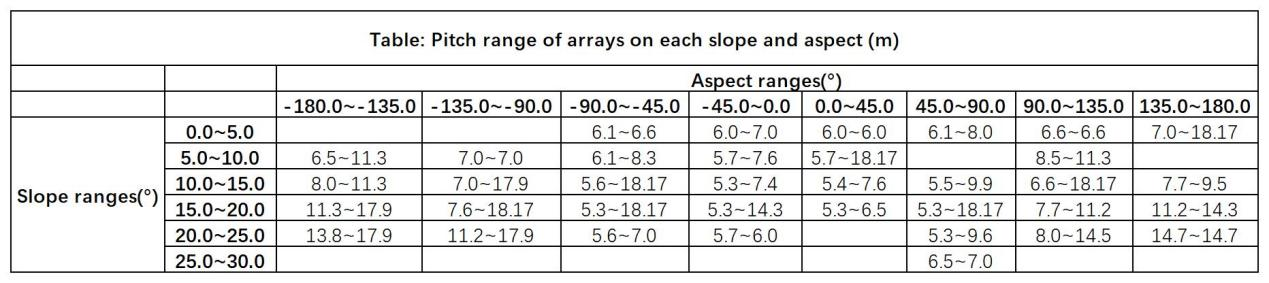
4) by terrain slope and aspect


5) Count arrays by terrain orientation

6) Statistics based on the angles of the southern and northern slopes of the mountains

7) Statistics based on Terrain E-W slope

8) Statistics by arrays' nominal tilt/azimuth/base slope

A total of 16 types of tables can be exported, and analysis can be conducted separately based on All/Selected arrays/Selected areas, which basically covers all key points of expert review.
Article Comments(0)