1. There is a discrepancy between the photovoltaic plane radiation amount in the Report and the photovoltaic plane radiation amount in the Orientation. Why?
[Answer from Teacher Chen]: As shown in Figure 1, the project site is in Hangzhou, and the source of meteorological data is Meteonorm7.1 software. The tilt angle for photovoltaic installation is 25°. In the Oritentation optimal tilt angle selection interface, the software itself only enables users to adjust the tilt and azimuth angles, facilitating a quick judgment of the optimal tilt and azimuth angles. However, the specific radiation values are approximate. As shown in Figure 3, the annual radiation amount is 1263kWh/m2. The radiation value obtained after simulation as shown in Figure 4 is an accurate value. As shown in the fourth column of Figure 4, the annual radiation amount is 1256.6kWh/m2, so this value should be used as the standard.
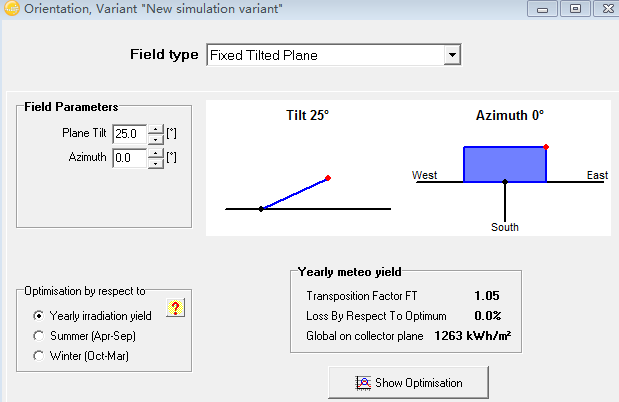
▲Figure 1
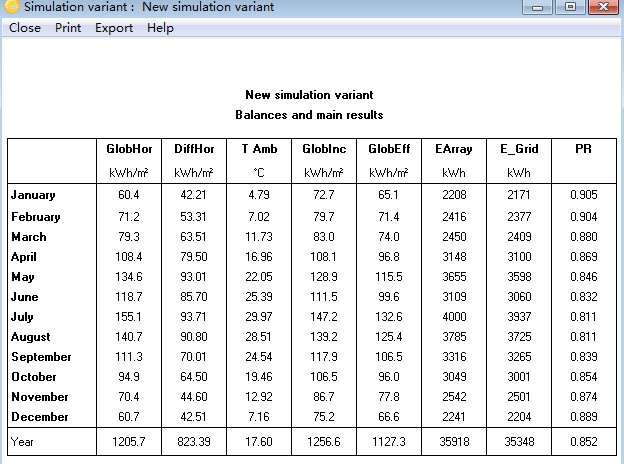
▲Figure 2
2. Open the meteorology data (in SIT format) of a certain project site, modify the horizontal radiation amount for a certain month, but why hasn't it changed after simulation? What is the correct operation procedure?
Background of the topic: The meteorological data queried by software is generally historical average data. If we have on-site measured monthly irradiation data, we can input the real value and modify the monthly meteorological data values (in SIT format) for a specific project site. However, many trainees have reported that after modification, the horizontal radiation values in the simulation results have not been updated accordingly.
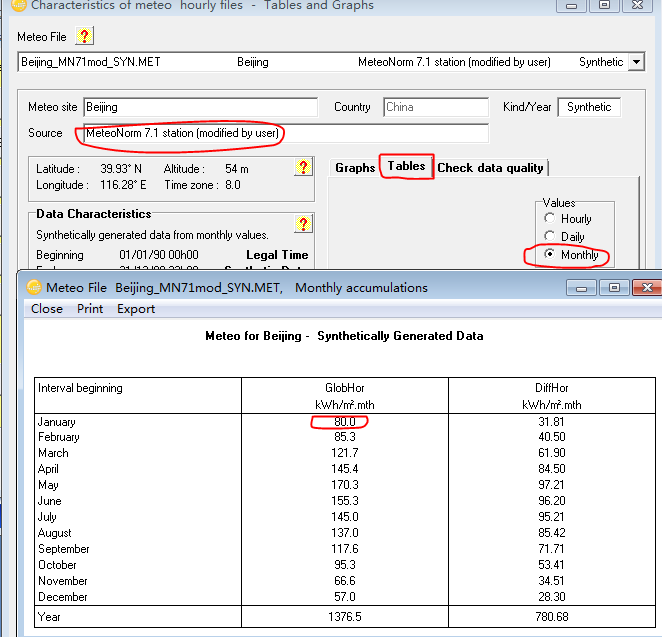
[Teacher Chen's answer]: The correct operation is as follows. Taking the Meteonorm7.1 meteorological data of Beijing as an example, we open the geographic information and monthly meteorological data interface of the Beijing project site as shown in Figure 3, and change the horizontal radiation amount for January from 66.9 kWh/m2 to 80 kWh/m2. After modification, a save dialog box will pop up. If you want to overwrite the original meteorological data, click OK; otherwise, you need to modify the original file name. Open the database Database, click "Synthetic hourly data generation", which will generate hourly meteorological data. A dialog box as shown in Figure 4 will appear. Click "Execute Generation". After this operation, we open the database Database again and click "Meteo tables and graphs", as shown in Figure 7. Pay attention to the red boxed area in the figure, where we can see that the radiation amount for January has been modified. Without going through the above steps, it is impossible to make modifications.
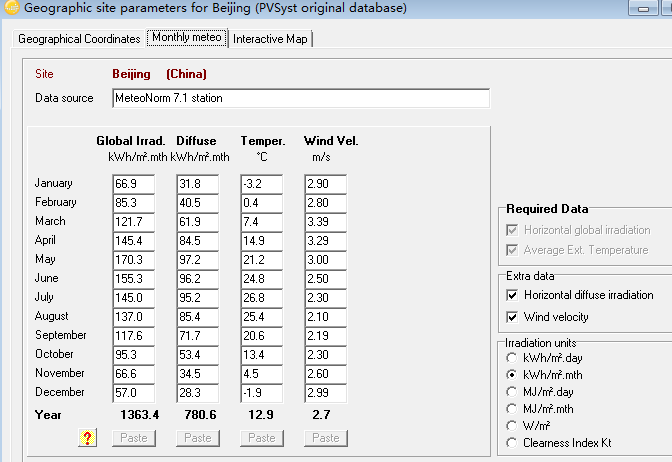
▲Figure 3
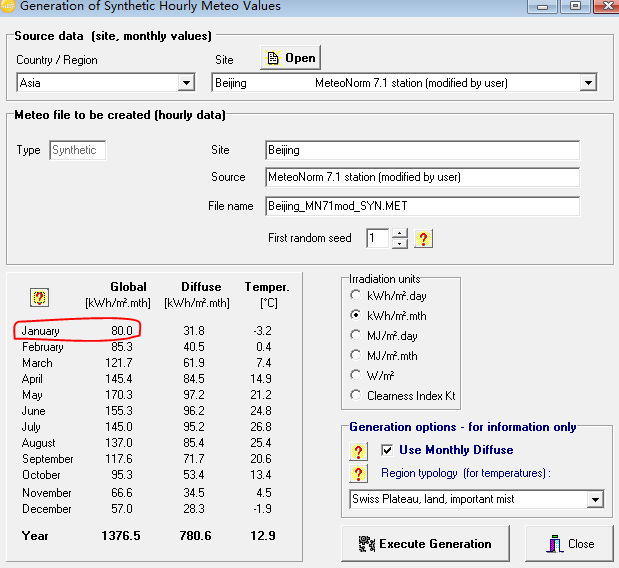
▲Figure 4
▲Figure 5
3. Solutions to the lag issue related to the establishment of new meteorological stations.
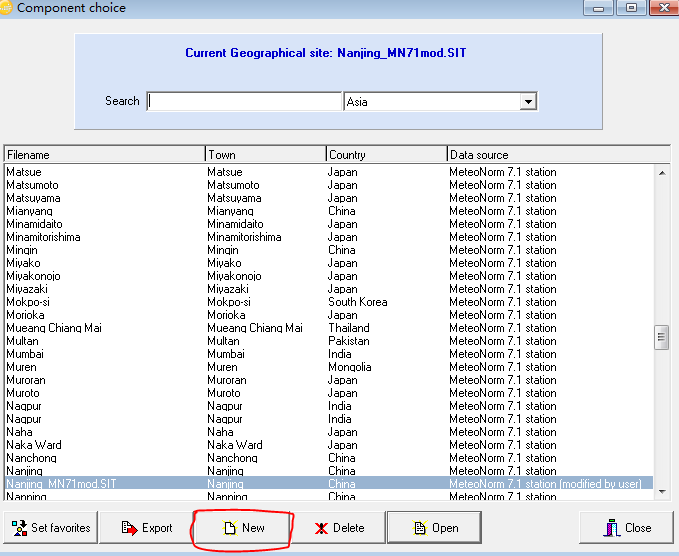
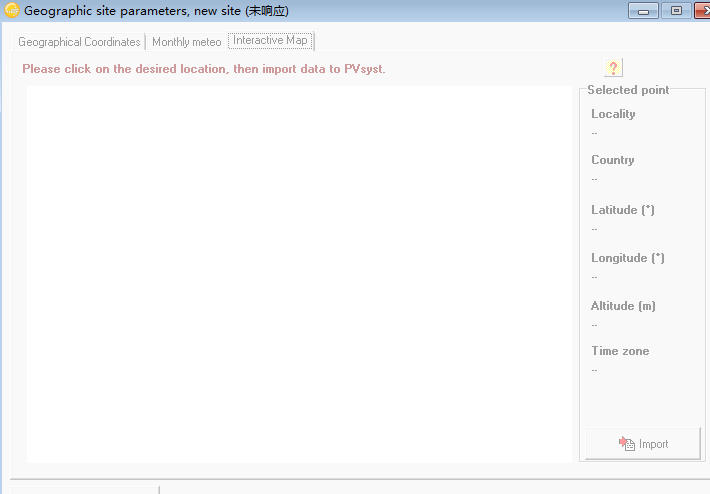
[Teacher Chen's answer]: Many users often encounter issues as shown in Figure 6 when clicking "NEW" to create a new weather station, specifically, the Google Maps interface becomes sluggish and unresponsive. Since Google Maps is currently blocked and unavailable, here are some tips for you.
▲Figure 6
▲Figure 7
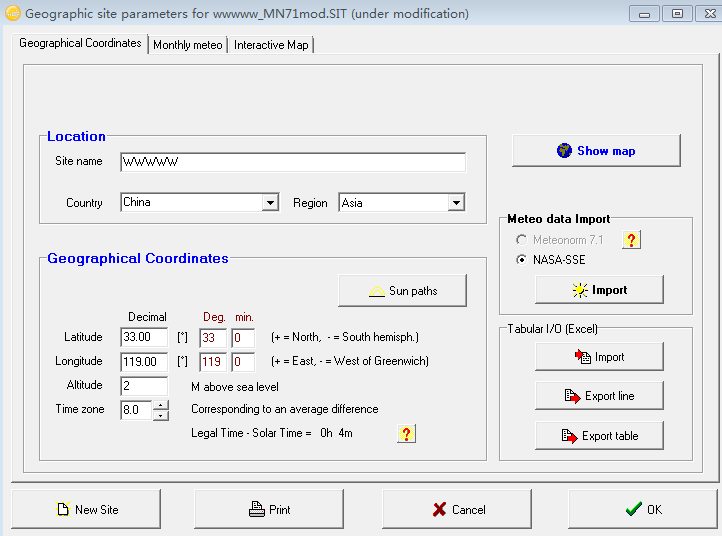
We only need to click on the interface shown in Figure 6 to open any of the already established meteorological stations, and then directly modify the name, longitude and latitude, elevation, and time zone of the meteorological station within it. Click on the imported meteorological type Meteonorm7.1 or NASA.
▲Figure 8
Article Comments(0)