1. What issues should be considered when simulating a photovoltaic power station on water using PVsyst?
[Teacher Chen]:
1) Energy balance coefficient
Installing PV modules on the water surface, in actual operation, due to the evaporation of water vapor on the water surface, the ambient temperature on the water surface will be lower than that on normal land, so the temperature of the modules will also be lower. According to the energy balance theory, the temperature of the modules is related to the ambient temperature, the irradiance on the inclined surface of the modules, the transformation efficiency of the modules, the absorption coefficient of the modules, and the U value (also known as the K value).
U · (Tcell - Tamb) = Alpha · Ginc · (1 -Effic)
Additionally, U = Uc + Uv · v, where Uc is a constant and Uv is a variable related to wind speed.
→ Extract U-value based on on-site measured data:
Based on different installation methods, PVsyst also provides empirical data. If you want to obtain a more accurate U value, you can install test equipment on-site to collect data. This requires a PV module temperature probe and an environmental monitor (to collect environmental temperature, oblique irradiance, and wind speed). By drawing a function curve of (Tarray-Tamb) versus oblique irradiance and performing bilinear fitting (including wind speed) or simple linear fitting (assuming no wind speed, with Uv being 0), the U value can be extracted.
2) Albedo
The albedo on the water surface is generally low, around 0.1. For fixed-tilt photovoltaic (PV) modules that generate electricity from the front side, the obstruction ratio of reflected radiation for the entire PV plant area is (n-1)/n, where n is the number of arrays. For example, if n=100, then the obstruction ratio is 99%, which means that from the second row of arrays onwards, the contribution of albedo to front-side electricity generation is only 1%.
2. What is the difference between Ageing and No Ageing in the Simulate process of PVsyst?
[Teacher Chen]: The degradation of PV modules is divided into two parts. The first is light-induced degradation, also known as LID, and the second is degradation due to material aging. LID occurs shortly after a PV module is installed outdoors and exposed to a certain amount of solar radiation.
As shown in Figure 1, we need to set this parameter during simulation. Another part of the attenuation is due to degradation caused by material aging, which generally does not exceed 0.7% per year. In PVsyst, the average degradation rate is set, with a default value of 0.4%. Of course, this is data obtained from long-term outdoor experiments conducted by the PVsyst research team for your reference.

▲Figure 1
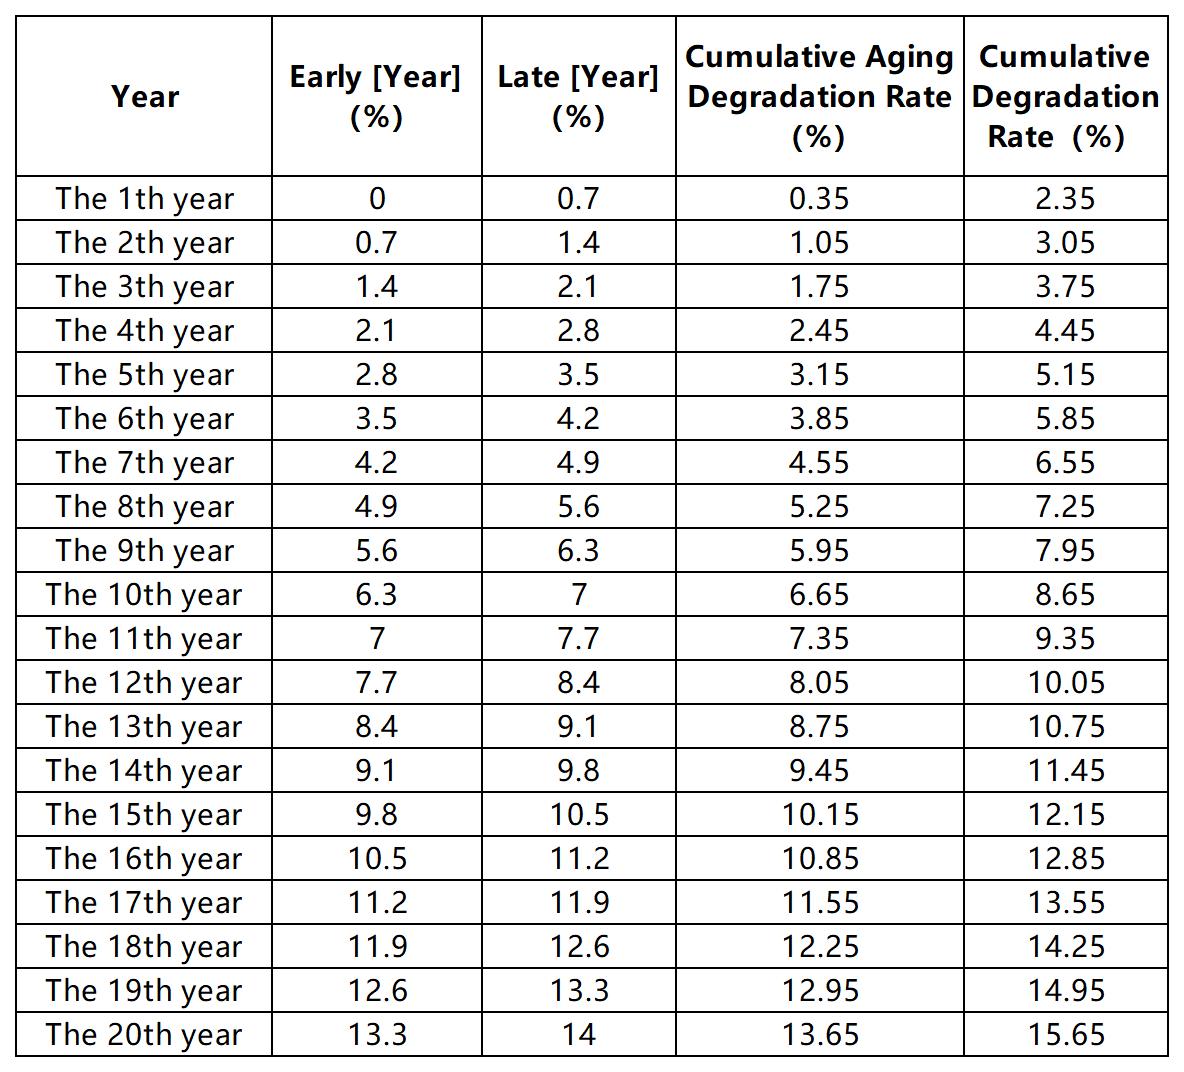
We can set the degradation rate due to material aging in Figure 2, for example, to 0.7%. Starting from 0% degradation at the beginning of the year and ending at 0.7% at the end of the year, the annual degradation is 0.35%.
For example, in Year 7, the cumulative degradation due to material aging is 4.55%. When combined with the initial LID, assumed to be 2%, the cumulative degradation rate becomes 6.55%.

▲Figure 2
The degradation rate due to material aging in other years can be calculated based on the aforementioned principles.
▼Table 1
3. In PVsyst simulation, LID=0% and LID=2% are set respectively. Is the difference in power generation between the two after simulation the LID loss?
[Teacher Chen]: This calculation method is actually inaccurate because LID is not set. If the system's capacity-matching ratio is large, it will cause some overload losses. If LID is set, the overload losses will be reduced.
4. How to understand the meanings of the two variables Tarray and TArrWtd?
[Teacher Chen]: Tarray – Average module temperature during operation: The average temperature of the photovoltaic array during operation.
TArrWtd – Module temperature weighted by Globinc: The temperature of the photovoltaic array, weighted by irradiance during operation.
As shown in Figure 3, Tarray represents the average daily working temperature for each day of the month in January, while TArrWtd denotes the irradiance-weighted average of the daily working temperature for each day of the same month. These two values are distinct.

▲Figure 3
Article Comments(0)