1. How to display the PR temperature correction value CPR in the Report for PVsyst version 6.75?
[Teacher Chen from Candela Academy]: Open the simulated report using PVsyst and click on "Settings" in the top left corner, as shown in Figure 1. The PR temperature correction value CPR is displayed in the form of a graph or table. Check "Graph options" to display it in the form of a bar graph. In the "monthlyresults table", select the 8th column to display "Weathercorrected PR" in the form of a table. Refer to Figure 2.
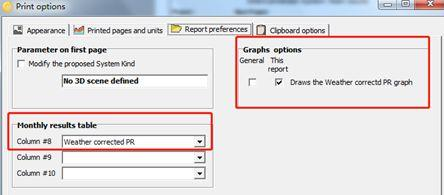
▲Figure 1
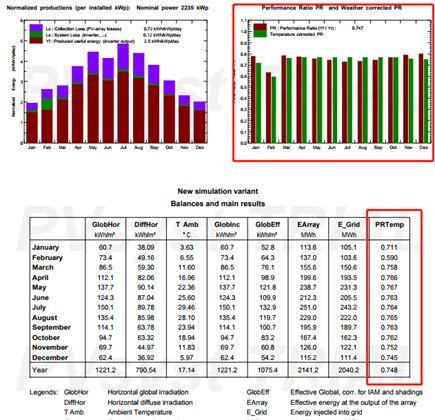
▲Figure 2
2. How does PVsyst import the PAN file of the PV module?
[Teacher Chen]: Open the software's main interface, click "Files", select "import components", place the PAN file on the desktop, browse the desktop and select the desktop folder, and once the "import" button changes from gray (indicating it is unavailable) to a usable state, click to import.
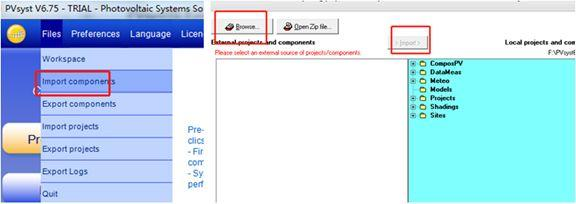
▲Figure 3
3. In the PVsyst model, what is the maximum tilt angle achievable for a double-sided PV module power generation system with a fixed tilt angle?
[Teacher Chen]: In the current version PVsyst6.XX, it is recommended to use a tilt angle not exceeding 60 degrees.
4. Can meteorology data from Meteonorm version 7.2 be exported to PVsyst version 6.74?
Answer: Since the PVsyst 6.74 version, it has supported importing meteorological data from Meteonorm 7.2 version, as shown in Figure 4.

▲Figure 4
5. How to import the measured or DIY processed radiation data into PVsyst?
[Teacher Chen]: The actual meteorology data can be measured at hourly, minute, or daily intervals. Before importing into PVsyst, it is necessary to check whether the data format has been preprocessed according to PVsyst's format protocol (pay attention to the format of date and time as well as the separation between various variables), and save it as a file with a .csv extension.
As shown in Figure 5, the processed data includes a row labeled No. 10 in Column 1, where 01.07.200400:00 represents 12:00 AM on July 1, 2014. POA stands for the radiation amount on the photovoltaic plane, and Tamb represents the ambient temperature. After preprocessing with EXCEL, the default separator between columns may be a comma. For the specific import operation process, please refer to the animation demonstration (recommended to view on WIFI or a good network environment).
The format protocol used can be modified by opening the default protocol of PV (Meteo ASCII File Format protocol). It is important to pay attention to the date format and the column position of each variable. The modified format protocol can be saved locally on the computer (with a MEF extension) for future use.

▲Figure 5
▲Figure 6
6. How to simulate the yield over multiple years in PVsyst and present it in a report?
Answer from [Kandela Academy Teacher Chen]: Click "Advanced Simul." (Advanced Simulation), and select "Aging Tool". When simulating multi-year energy production, two points need to be considered. Firstly, the setting of the module degrad. factor. Generally, unless there are special circumstances, the default parameters of PVysst can be used. Secondly, the selection of the meteorological data source. If the meteorological data source is Meteonorm multi-year average, the operation can be carried out according to the sequence shown in Figure 8.
The first step involves setting the module_degradation_loss rate, the second step is selecting the meteorology data source, the third step is setting the simulated year span, for example, if simulating electricity generation for 16 years, the number 16 can be set, and the fourth step is simulation. The red box in the middle represents the year, and there are two radio buttons above indicating whether to generate a report (Generate report) and a variant (Generate variant).

▲ Figure 7

▲ Figure 8
If the data source covers multiple specific years, such as from 2007 to 2016, you can follow the steps shown in Figure 9. The final simulated report will be the yield of electricity generation for these specific years, presented in the form of a chart and a PDF report, as illustrated in Figure 10.

▲ Figure 9

▲Figure 10
Article Comments(0)