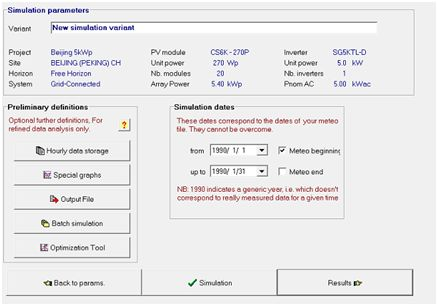
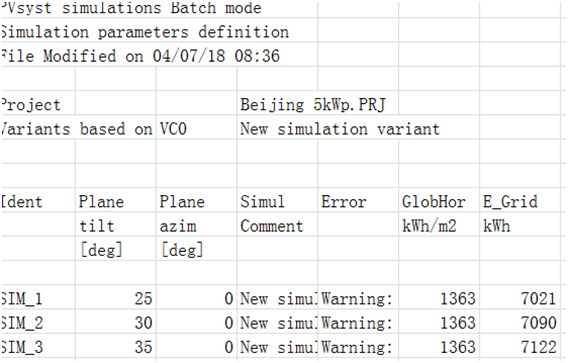
1. Can the batch processing mode Calculate the yield Data for a specific month?
[Teacher Chen from Candela Academy]: For the batch processing type, currently, it can only be simulated for the entire year.
▲Figure 1
▲Figure 2
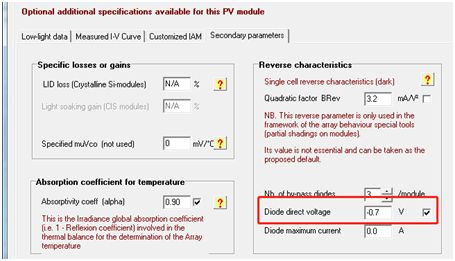
2. What does -0.7V mean in the PV module panfile?
[Teacher Chen from]: As shown in Figure 3, the -0.7V indicated by the red wireframe represents the reverse voltage of the bypass diode.
▲Figure 3
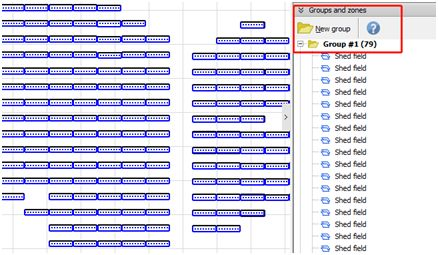
3. How to batch modify the tilt and azimuth of PV modules or arrays in the 3D modeling interface?
[Teacher Chen]: As shown in Figure 4, you can use the "Group" function to incorporate arrays or PV modules into the group, allowing for one-time selection for batch modification.
Click on "Group#1 (79)", where the number 79 indicates that there are 79 arrays in this group. Right-click the mouse to see "Select all objects in the group". After selecting, click on any Shedfield button to see "Modify selected objects" or the shortcut key "Ctrl+G". A parameter modification interface will pop up, as shown in Figure 5.
▲Figure 4
You can modify the overall X, Y, Z coordinates of all selected arrays, or adjust their azimuth, installation inclination, color, width, length, array quantity, East-west spacing, and other parameters. If you need to uniformly rotate the selected arrays by 35 degrees, you can use "Rotate by 35" and "All objects uniformly".
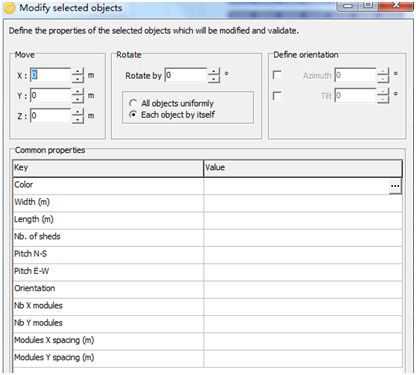
▲Figure 5
4. How is the PR of a Bifacial system calculated?
[Teacher Chen]: As shown in Figure 6, the PR calculation for a bifacial power generation system requires consideration of the bifacial power generation coefficient. From the figure, it can be seen that the radiation gain percentage on the back side is 11.2%. When calculating PR, multiplying by the bifacial power generation coefficient yields 9.52%.

▲Figure 6
Refer to the calculation method for PR in conventional systems as described in the document. For bifacial systems, the original calculation needs to be multiplied by (1 + bifacial gain coefficient), as shown in Figure 6, to obtain PR * (1 + 9.52%). It is important to note that the number of decimal places for losses affects the accuracy of the calculated value, and it can be adjusted up to 3 decimal places.
5. Can PVsyst software import user's load Data during simulation?
[Mr. Chen from Candela College]: Yes, this feature is particularly useful for distributed projects, as it allows for the calculation of the self-consumption rate. As shown in Figure 7, PVsyst provides many types based on user needs. Generally, the most commonly used one is the last one, which can be referenced in the PVsyst installation directory:
"c: Program Files (x86) PVsyst6.x.x UserData ."HourlyParameter_Template.CSV".".
This is an ASCII (CSV) demonstration file with Hour as the step size.
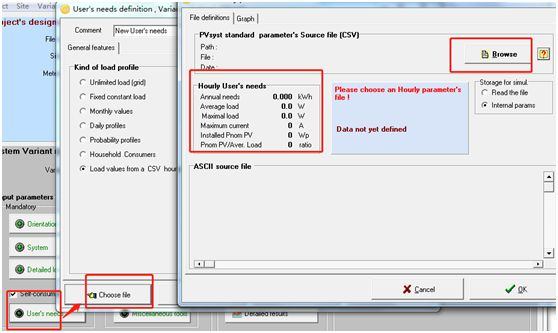
▲Figure 7
After Import, as shown in Figure 8, the Annual load demand is 609kWh, the Average power is 70W, and the maximum power is 200W.
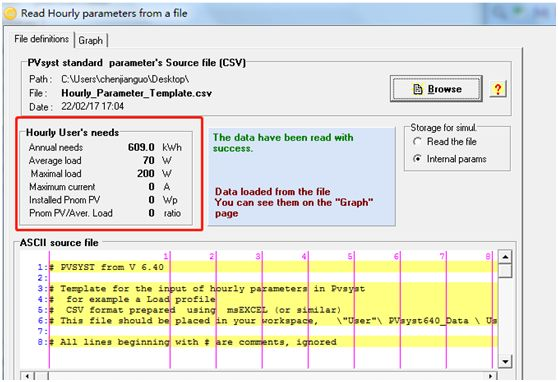
▲Figure 8
6. Can the grid-connected photovoltaic power generation system set load limits?
[Teacher Chen]: Yes, you can open the "Miscellaneoustools" button. As shown in Figure 9, enter the set power limit value, and you can choose to limit it at the inverter's AC output terminal or at the Grid point.
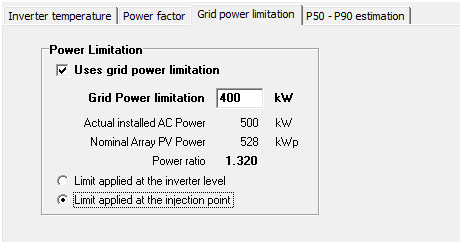
▲Figure 9
Tip: Interested readers can browse historical articles to look up issues encountered while using PVsyst.
Article Comments(0)