In the process of using PVsyst software, have you encountered similar issues such as how to correctly set two different orientations in 3D modeling? What should you do when an error is reported after importing measured radiation data into PVsyst? How to quickly select PV string arrays in the 3D modeling interface? With these series of questions, Candela Academy continues to launch the 13th issue of the practical Q&A series. Please see this issue for answers to your questions.
1. The photovoltaic array model in the 3D modeling process belongs to two orientations and tilts, but there is a problem as shown in Figure 1, where Orientation 1 and Orientation 2 are the same. How can this be resolved?
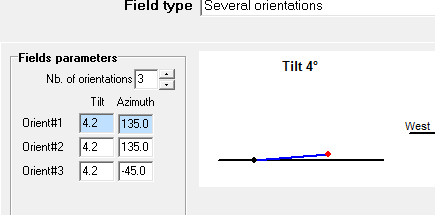
▲Figure 1
[Teacher Chen from Candela Academy]: As shown in Figure 2, the arrays are arranged along the north and south slopes of the roof using "Domes PV tables", with a slope angle of 3 degrees. If the arrays on the south slope are established and then directly copied and rotated by 180 degrees, the situation shown in Figure 1 may occur.
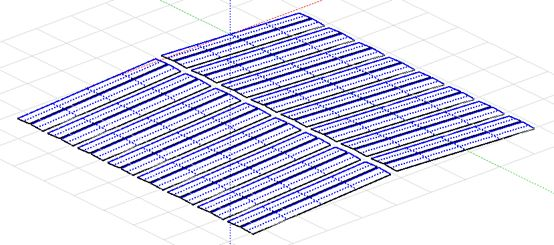
▲ Figure 2
▲Figure 3
The correct approach is to establish an array on the southern slope, duplicate the array model, modify the "Baseline slope" angle from "3°" to "-3°", and then adjust the position using the Move Tool.
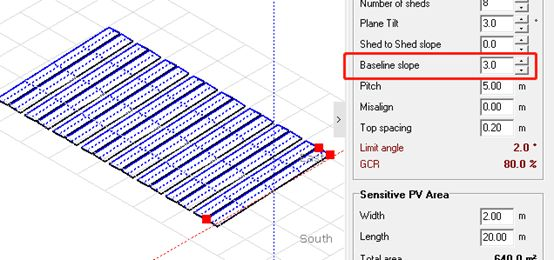
▲Figure 4
2. A photovoltaic power station array with three orientations is connected to the same central inverter. Can it be simulated in PVsyst software?
[Teacher Chen]: For a single MPPT, we currently do not support three different orientations. You can redefine the single-channel MPPT of the centralized inverter as a multi-channel MPPT, and then establish sub-arrays with different orientations, each connected to a different MPPT. If the installed capacities of the sub-arrays with different orientations are different, you can use the "Power sharing" button.
3. How to understand the solar trajectory diagram?
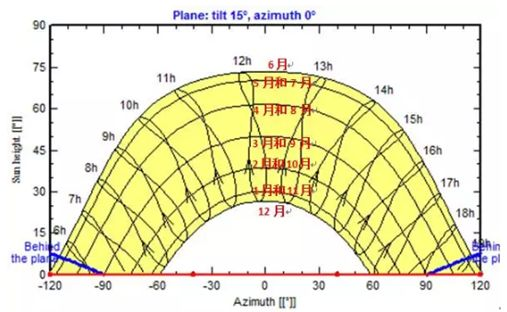
▲ Figure 5
[Teacher Yang from Candela Academy]: The solar trajectory diagram describes the position of the sun using its azimuth and altitude angles. The horizontal axis represents the sun's azimuth, while the vertical axis represents its altitude angle. The curves in the solar trajectory diagram include several parabolic curves and seven lines in the shape of an 8, representing the trajectories of the sun from morning to night around the 21st of each different month, as indicated by the red text in Figure 1. The 8-shaped curve represents the annual solar trajectory at various time points throughout the day. For example, by marking the position of the sun at 11 o'clock every day of the year on the coordinate system, we obtain the 8-shaped curve corresponding to 11h. Arrows are marked on the 8-shaped curve to indicate the direction of the trajectory, distinguishing between different months on the same parabolic curve.
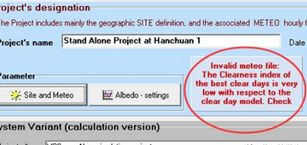
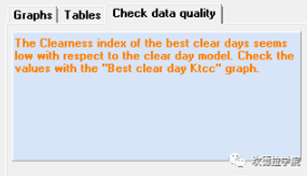
4. What should I do if there is an error when importing certain ASCII Meteorology data into PVsyst?
Question 1: PVsyst software prompts an invalid meteorological file, namely InvalidMeto file: "The clearness index of the best clear days are very high with respect of to the clear day model".
Question 2: Invalid Metofile: "The clearness index of the best clear days is very low with respect to the clear day model" or "The clearness index of the best clear days seems low with respect to the clear day model", as shown in Figure 6 and Figure 7.
▲Figure 6
▲ Figure 7
[Teacher Chen]: For question 1, the system believes that the Ktcc obtained through PVsyst calculation is higher than the default model value. We can solve this problem by adjusting the default value of 1.2 (Best Ktcc days have strongly high values) to a higher value.
Similarly, for question 2, the system believes that the Ktcc calculated by PVsyst is lower than the default model value (some areas may have a very low clear sky index due to haze). We can lower either of the default values of 0.88 (Best Ktcc days have strongly low values). For specific values to lower, please refer to the following two images to view the Best clear days Ktcc for this meteorological station.
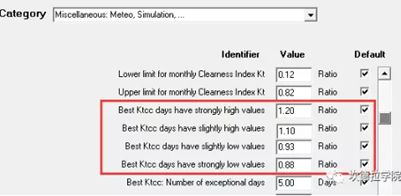
▲ Figure 8
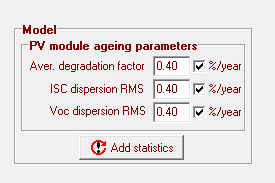
5. Regarding the inconsistency in electrical performance caused by uneven degradation of PV modules, what are the default values?
[Mr. Chen from Candela]: PV modules degrade annually. According to the current industry consensus, conventional monocrystalline modules experience a 3% degradation in the first year and a 0.7% annual degradation from the second year onwards. However, the degradation of each module is not uniform, and this inconsistent degradation can exacerbate the mismatch loss in the string. In the PVsyst system setup, the annual increase rate of the dispersion rate of short-circuit current and open-circuit voltage is 4% (default value). You can query this in the grid-connected system design → "Detailed losses" → "Ageing". The calculation model for mismatch loss employs the Monte Carlo statistical method.
▲ Figure 9
6. Regarding the 3D modeling interface, how can I quickly select PV modules or strings?
[Teacher Chen]: In the 3D modeling interface, you can refer to the animated image below for operation guidance.
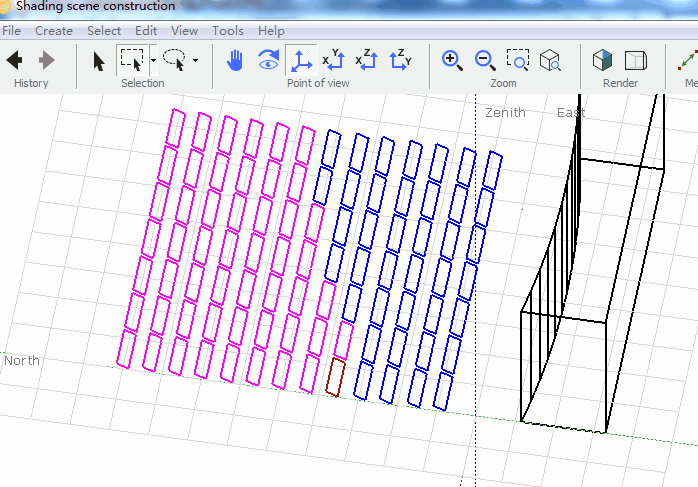
▲Figure 10
7. Can half-cut PV modules currently be simulated using PVsyst?
[Teacher Chen]: Currently, simulation of half-cut PV modules is not supported.
Tip: Interested readers can refer to past articles to search for issues encountered while using PVsyst.
Article Comments(0)