1. The capacity-matching ratio of the photovoltaic system has been set to 1.42, but the power output limit is set at 1.1%. Is this accurate?
[Teacher Chen from Candela Academy]: Currently, PVsyst can effectively simulate and emulate the setting of over-matching ratio and whether there is a limit on loss due to over-matching. As shown in Figure 1, in the system settings interface, we can obtain rough values of overload loss under different Pnom ratios.
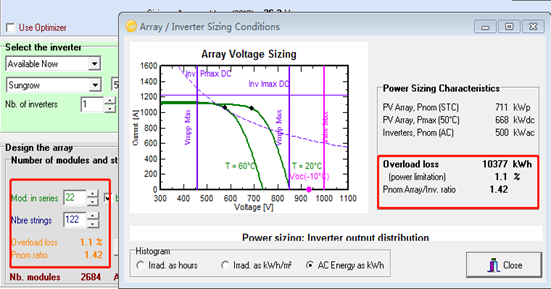
▲Figure 1
After the Simulate ends, we can see more detailed overload losses in the "Detailed inverter losses" section of the simulation results, as shown in Figures 2 and 3.

▲Figure 2
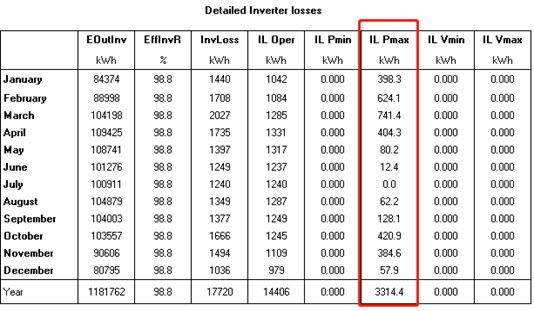
▲Figure 3
2. If there are measured environmental temperature and horizontal plane irradiation data for a certain project site, how can they be quickly imported into PVsyst software for use?
[Teacher Chen]: If you have the radiation data for one month and the average ambient temperature of that month, you can set it up in the PVsyst project, as shown in Figure 4. Open the monthly meteorological data (SIT) for a specific project location, modify the radiation and ambient temperature for the month, save the changes, and then open "DataBase" → "Generation of synthetic hourly meteo values" to regenerate the hourly data before use.
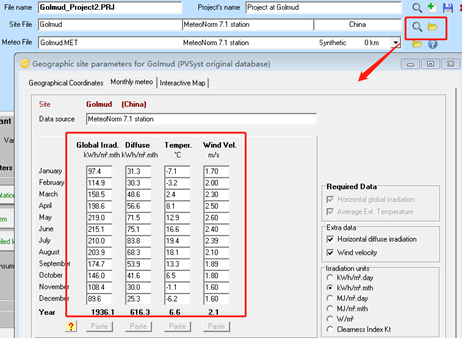
▲Figure 4
3. In PVsyst simulation, how to solve the problem when the following English prompt appears?
[Teacher Chen]: The reason for this situation is that "Unlimited sheds" was selected in the "Orientation" parameter option, and arrays were also defined in "Near shadings". In this case, PVsyst will perform shading calculations twice, which is not allowed. Therefore, a red warning message as shown in Figure 5 will appear.
Generally, PVsyst software offers two methods for setting shadows. The first method, as mentioned above, involves defining the width, Tilt, spacing, and electrical influence of the arrays in the System through the "Orientation" parameter option, as shown in Figures 6 and 7. However, there is no need to create a three-dimensional model within "Near Shadings".
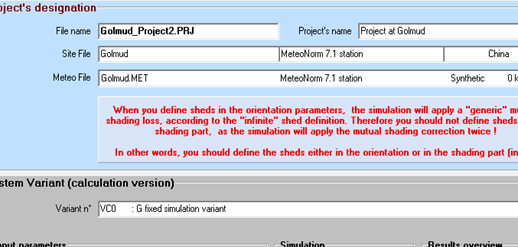
▲Figure 5

▲Figure 6
▲Figure 7
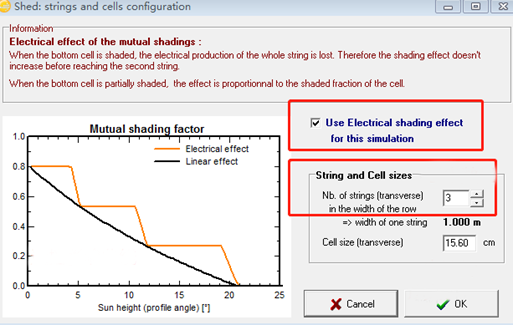
In the electrical effect settings interface, it is necessary to check "Use Electrical Shading effect". For the number of strings, the setting is 1 for regular components and 3 for smart components (string-level optimization).
The second method is to select "fixed tilted" or "multi-orientation plane" in the "Orientation" parameter option, and then set the specific layout information of the arrays in the "Near shdings" interface.
4. Why is the array_output electric current 0A when the irradiation is less than 10W/m2?
[Teacher Chen]: When the irradiance is low, the current of the strings does not reach the starting power of the inverter, so the inverter does not start, and the output current is 0A. The threshold set by PVsyst is 10W/m2.
5. Meteonorm 7.1 (1991-2000), Sat=69%: Is the accuracy higher when the satellite data Ratio is large or when the ground data Ratio is large?
[Teacher Jiang from Candela Academy]: In theory, terrain data with a large ratio is more accurate.
6. Does the area marked with a red box in the figure below represent the production during the time period from 9 o'clock to 10 o'clock?

▲Figure 8
[Teacher Jiang]: The yield corresponding to the 10 points depicted in the figure is for the period of time from 10:00 to 11:00.
7. In the PVsyst toolbar, is the output power of the module the actual output power after considering the loss due to weak light and the loss of relative transmittance? Figure 9 below shows the output power curves of Poly 260 and Poly 270.
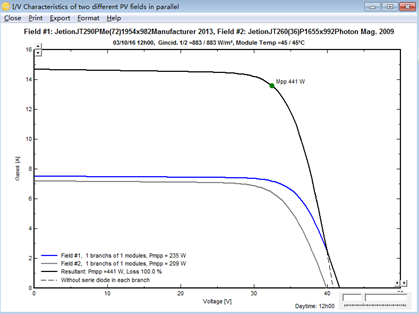
▲Figure 9
[Teacher Chen]: This I-V curve has taken into account the conversion efficiency of PV modules under low irradiation and the relative transmittance loss at different installation angles. Additionally, there are other parameters that can be set, such as installation angle, ground reflection coefficient (Aldebo factor, 0-0.5), horizontal diffuse radiation (Diffuse/Global), and radiation coefficient under clear sky model (default 100%).
8. When simulating power limitation in PVsyst, how should we solve the following situations?
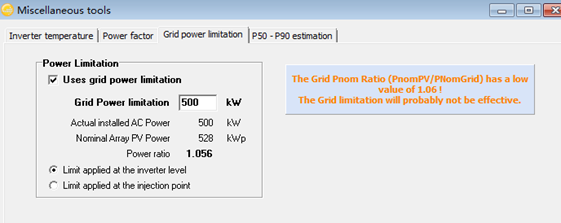
▲Figure 10
[Teacher Chen]: This issue arises due to the excessively low Pnom ratio of the System, as illustrated in the figure where it is only 1.06. It is necessary to continue enhancing the Pnom ratio of the System.
Tip: Interested readers can refer to past articles to search for issues encountered while using PVsyst.
Article Comments(0)