1. How can I obtain the yield of P65 in the Report?
[Teacher Chen]: In probability theory, P95 and P50 are commonly used terms, meaning there is a 95% or 50% reliability. For yield, reaching this value has a 95% or 50% probability. Ordered by the value, generally P95 < P50. That is to say, P95 is easier to achieve than P50. On the initial setting interface of the PVsyst grid-connected system project, we can find the "Miscellaneous tools" button shown in Figure 1. After opening, select "P50-P90 estimation". By default, PVsyst selects P50, P90, and P95 scenarios. As shown in Figure 2. If there is no measured value for the parameters on the left, default values can be used. Among them, the most influential is the irradiation data. According to the research results of PVsyst, the uncertainty of irradiation data can refer to Figure 3, which shows the relationship between the total horizontal radiation value and radiation uncertainty at the project site throughout the year. Below 1700 kWh/m2, there is basically a linear decrease relationship. If the radiation amount is around 1400 kWh/m2, then the value can be taken as around 4.8.
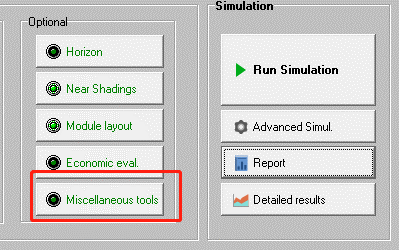
▲Figure 1
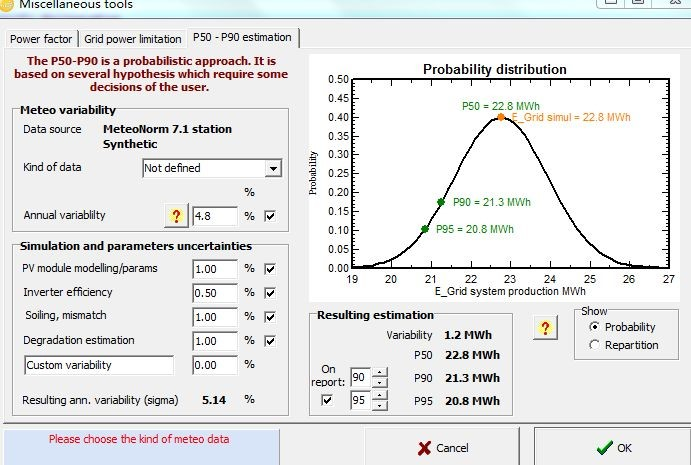
▲Figure 2
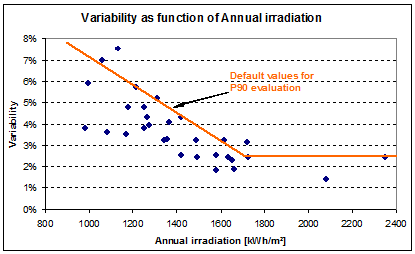
▲Figure 3
So how to display the result of P65 in the Report? As shown in Figure 4, within the Red line box, we can adjust the Default value of 90 to 65, and then run the Simulation command. The result can be seen in the Simulation Report, as shown in Figure 5.
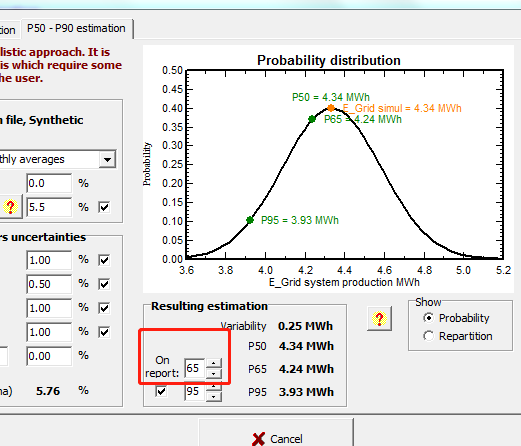
▲Figure 4
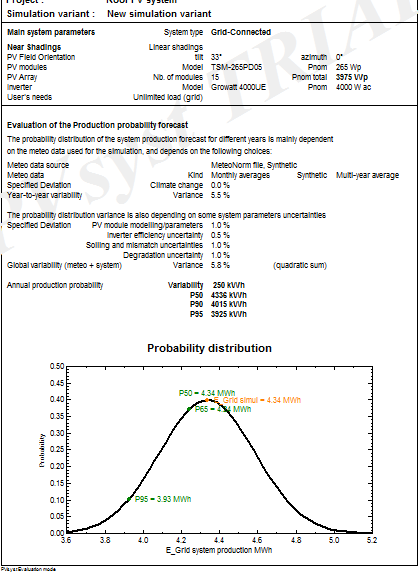
▲ Figure 5
2. How to Create a User Workspace?
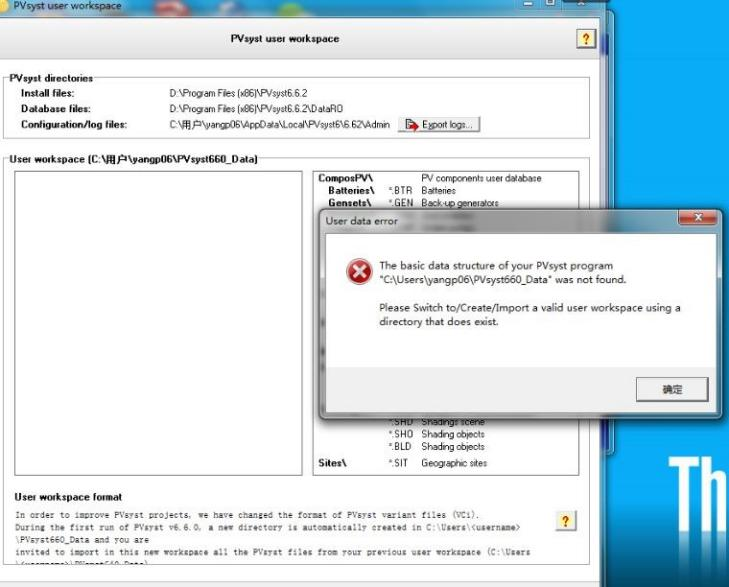
[Teacher Chen]: Many students have reported errors in the PVsyst data folder, as shown in Figure 6. In such cases, we can create a new user working folder. Click on the PVsyst main interface and navigate to "Files" → "WorkSpace", as depicted in Figure 7. The user working folder created in Figure 7 is located on the F drive. We can click Browse to select the desired location for the new folder, and then click "Create" to create it.
▲Figure 6
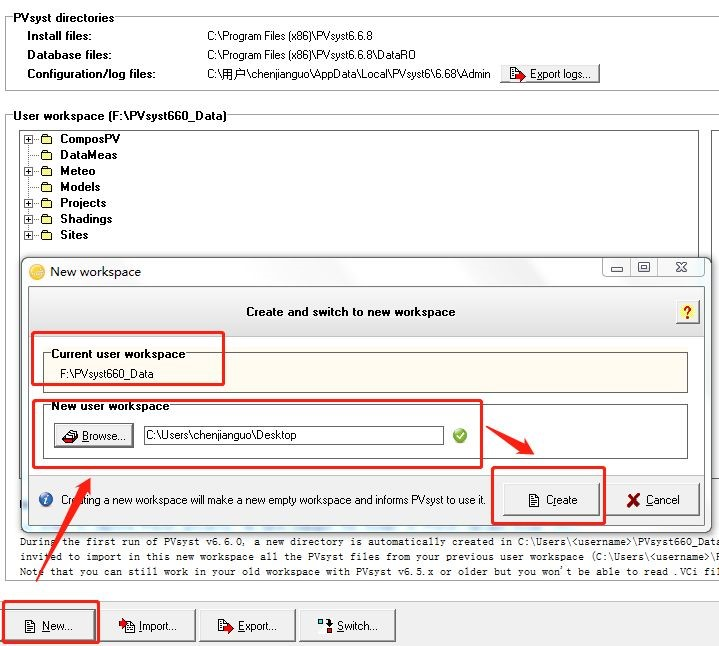
▲ Figure 7
3. How should the Module Quality Loss value for PV modules be set?
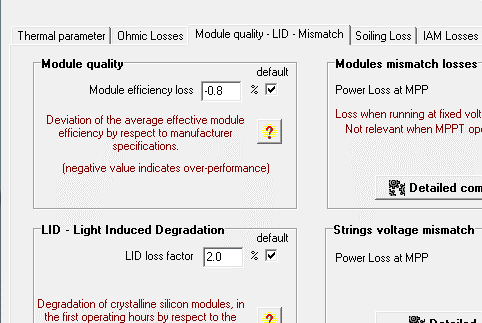
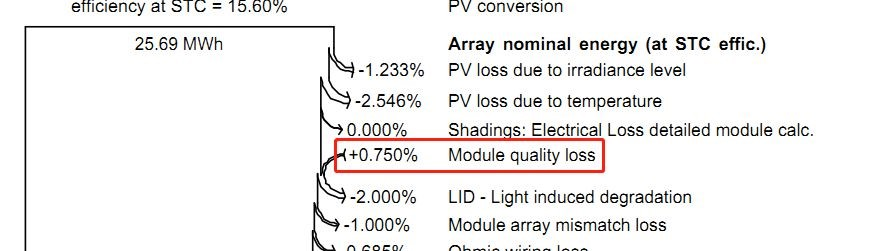
[Teacher Chen]: Currently, the power deviation of PV modules is generally a positive tolerance, such as 0 to 3%. For example, if the nominal rated power is 265Wp, the actual power range should be 265Wp to 273Wp. In the Module quality loss parameter settings column of the PVsyst module, this value is calculated based on the empirical values of PVsyst, typically as one-quarter of the difference between the minimum and maximum values of the tolerance range. As shown in Figure 8, for a positive tolerance of 0-3%, this parameter is -3%/4 = -0.75%. If the value is negative, it indicates a gain; if it is a negative tolerance, it is a positive value.
In the loss diagram of the simulation report, as shown in Figure 9, we can also observe the impact of positive tolerance on photovoltaic power generation. This is because the photovoltaic grid-connected generation capacity is generally calculated based on the nominal power of PV modules, and a positive tolerance can lead to an increase in production, as illustrated in Figure 9, with a gain ratio of 0.75%.
▲ Figure 8
▲ Figure 9
4. How to create a PAN file or OND file for a PV module or inverter?
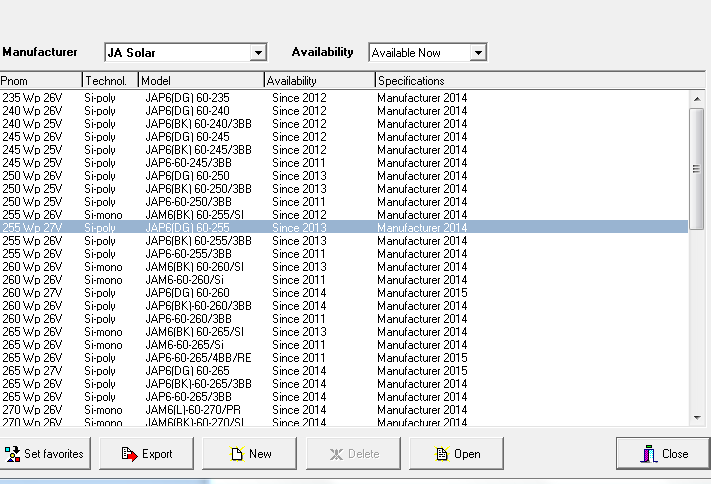
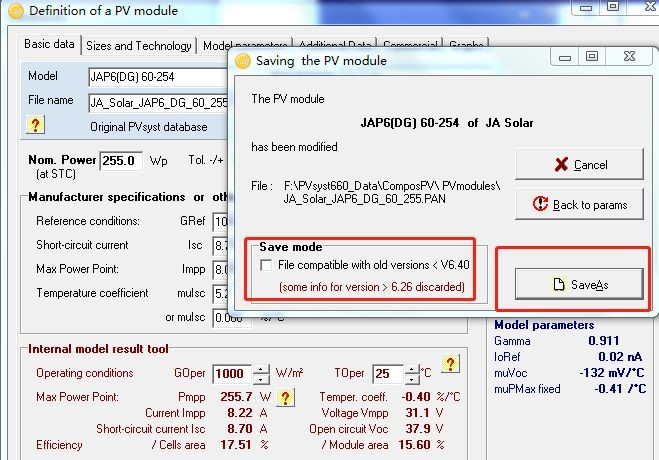
[Teacher Chen]: The PAN file for PV modules integrates common parameters of PV modules, and the OND file for inverters integrates common parameters of inverters. For PV modules, the PVsyst module database basically includes module data for various power levels from most module manufacturers both domestically and internationally, but some individual manufacturers or models are not included. In this case, we can randomly open any manufacturer's module, make modifications based on it, and then save it as a new file in the user's working folder mentioned in the second question of this article (ComposPVPV modules*.PAN), as shown in Figures 10 and 11. After saving, you can directly copy the file in this folder for other needs.
▲Figure 10
▲Figure 11
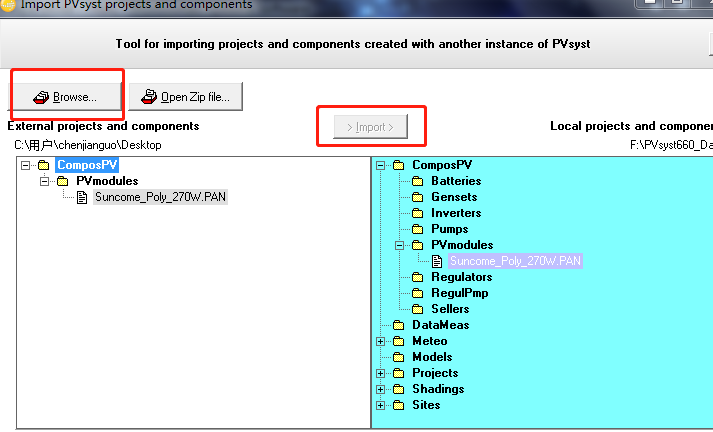
5. How should the PAN file or OND file of a PV module or inverter be imported into PVsyst?
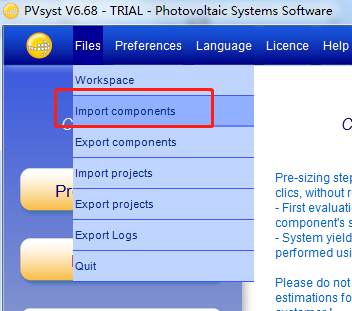
[Teacher Chen]: Click on "Files" on the PVsyst main interface → "Import components", click browse to locate the location of the PAN file you want to import. If I placed it on the desktop, select the desktop. Open the collapsed folders on the left with the mouse in turn, and select the PAN file you want to import. After completing the operation, the Import button status changes from gray (unavailable) to available. Click "Import" to import.
▲Figure 12
▲Figure 13
6. How to simulate the negative tilt angle of the north slope of a color steel tile roof? PVSyst does not support setting negative tilt angles. Is there any alternative method?
[Teacher Jiang]: For the north slope, you can set its azimuth to 180°.
7. Is there a recommended range for mismatch loss, such as for large ground-mounted solar power plants using 2500kW central inverters?
[Teacher Chen]: This needs to be set according to the actual situation, and can be done according to the following operation method. As shown in Figure 14, the interface of the current mismatch loss simulation tool is displayed. The first box on the left indicates the number of series and parallel connections. In the figure, there are 20 PV modules in one series, with a total of 16 series. During calculation, you can choose whether to divide the current into different levels, set the irradiance and NOCT temperature of the battery, and specify the range percentage or specific maximum deviation value for the random distribution of voltage and current. It is important to note that selecting or not selecting current division for PV modules can lead to significant differences in simulation results. After division, the current variation is smaller, so the mismatch loss will be lower than that without division. Everyone should be clear about this.
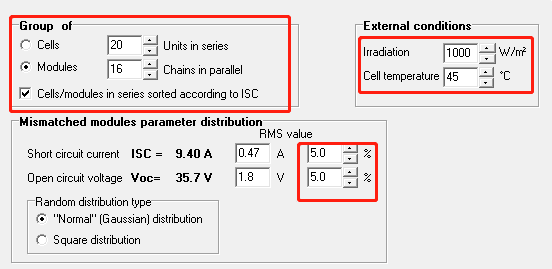
▲Figure 14
Figure 15 shows the green and black curves representing the results without and with mismatch loss, respectively. In the lower left corner, you can see the calculated power mismatch loss at the maximum power point is 0.2%, and the mismatch loss at 90% of the Voltage Maximum (Vm) is also 0.2%. It should be noted that due to the random generation of voltage and current values for calculation, the results may vary each time. When the sample size is small, the differences can be significant, so it is recommended to perform multiple calculations. After the calculation is complete, you can view the histogram, where the horizontal axis represents the loss ratio and the vertical axis represents the frequency, indicating the number of times the loss ratio obtained from multiple random simulations appears. Therefore, when setting the mismatch loss, you can choose a value with a high probability.
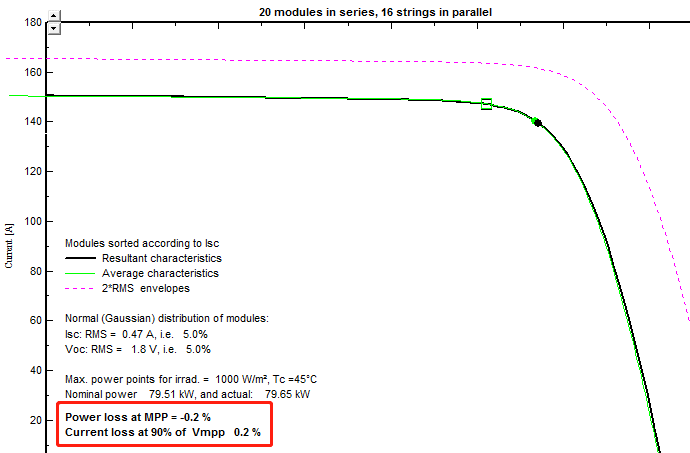
▲Figure 15
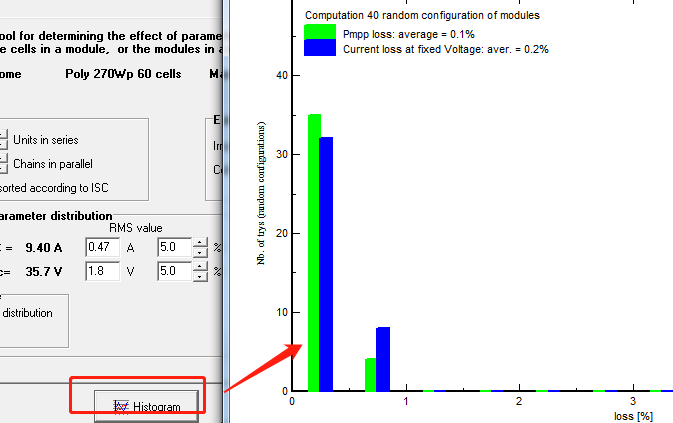
▲ Figure 16
Tip: Interested readers can refer to past articles to search for issues encountered while using PVsyst.
Article Comments(0)