1. Question: After solar tracking, the curve of the PV Rack Model does not take 12 noon as the symmetry point. What is the reason?
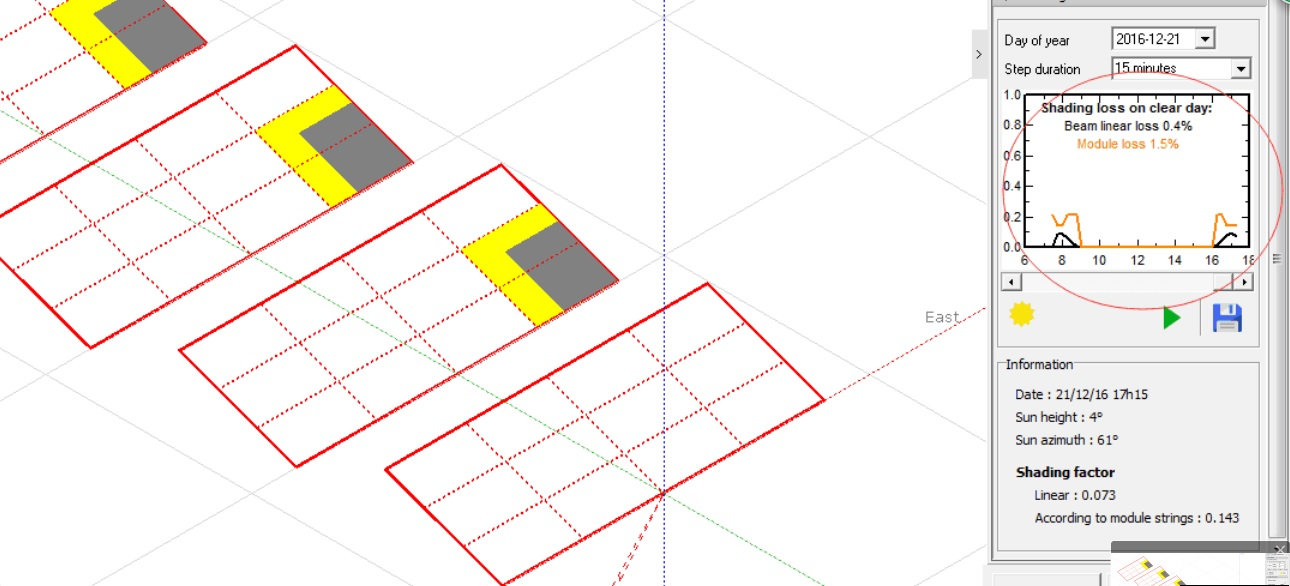
▲Figure 1
As shown in the figure above, the tracking curve is traced with 1 pm as the symmetry point. This issue did not occur in previous versions before the update.
[Answer from Teacher Chen]: The situation shown in Figure 1 occurs because the dynamic shadow simulation in the 3D modeling interface does not use Solar Time. PVsyst defaults to Legal Time. If Solar Time is used, as in the photovoltaic array shown in Figure 2, the shadow results will be symmetrical. However, it should be noted that if there are other obstacles near the photovoltaic array, the shadow results will generally not be symmetrical at 12 noon, regardless of whether the simulation is done using Solar Time or Legal Time.
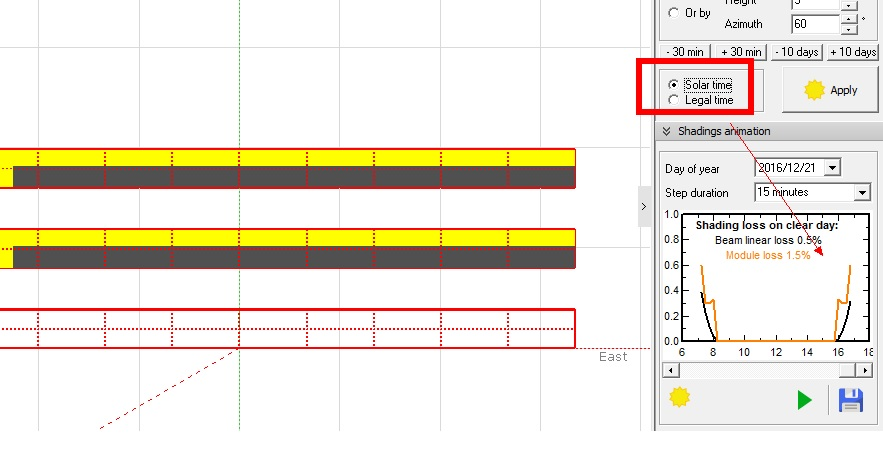
▲Figure 2
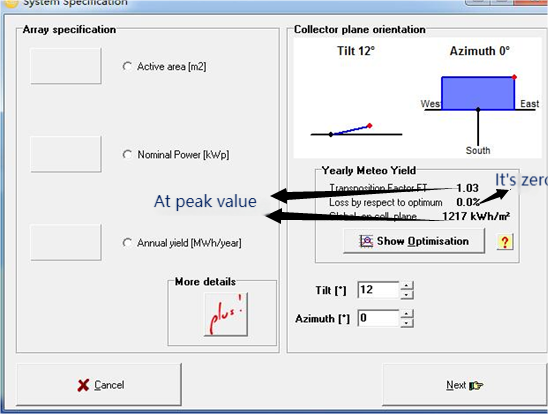
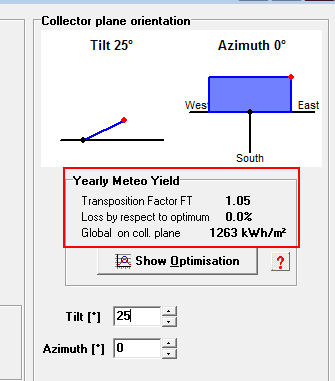
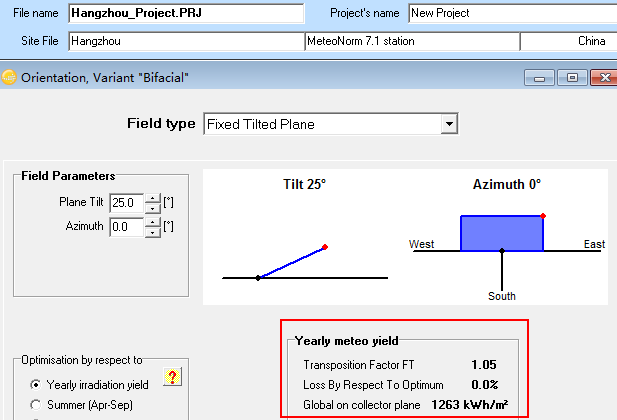
2. Question: The optimal tilt and radiation amount calculated in the Preliminary design do not match those calculated in the Project design model. The data measured in the Preliminary design is greater than the actual data calculated in the Project design model. What is the reason for this discrepancy?
▲Figure 3
▲Figure 4
As shown in the figure above, the optimal tilt calculated in Preliminary design is 12 degrees, but the optimal tilt measured in the Project design model is 10 degrees.
[Answer from Teacher Chen]: The optimal tilt and radiation amount calculated in the Preliminary design for the fixed rack should be the same as those calculated in the Project design Model. Please refer to PVsyst version 6.64. For example, in the Hangzhou region (Metenorm data), the radiation amount corresponding to a tilt of 25° is always 1263 kWh/m2.Additionally, it should be noted that the total annual radiation value on the "Orientation" interface is selected based on meteorological data from each month, allowing users to quickly determine the optimal tilt angle. However, this value may slightly differ from the actual annual radiation value in the simulation results.
▲Figure 5
▲Figure 6
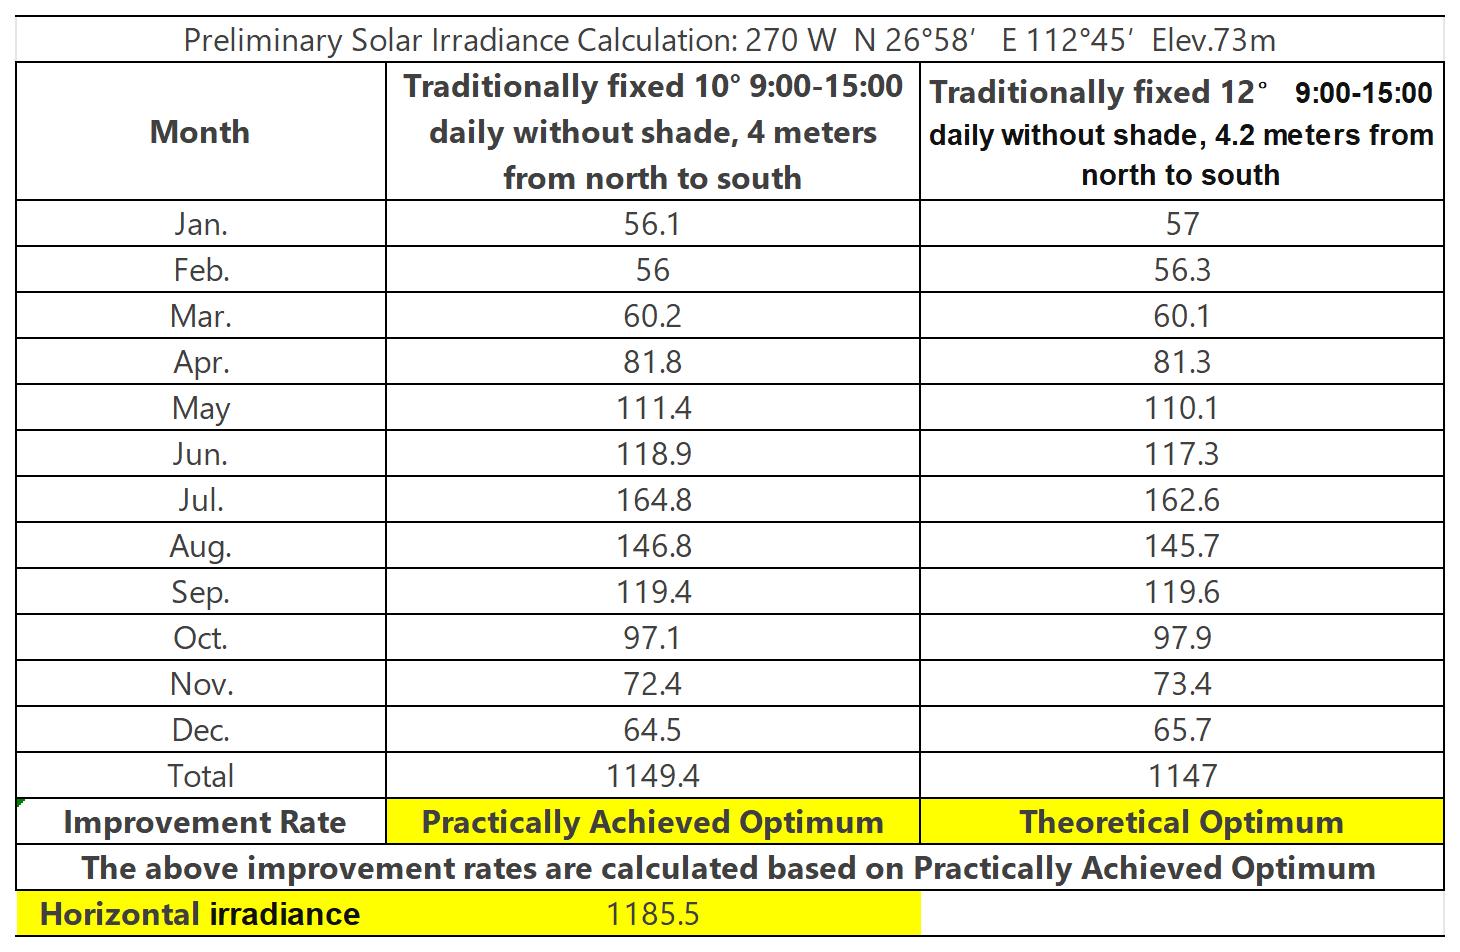
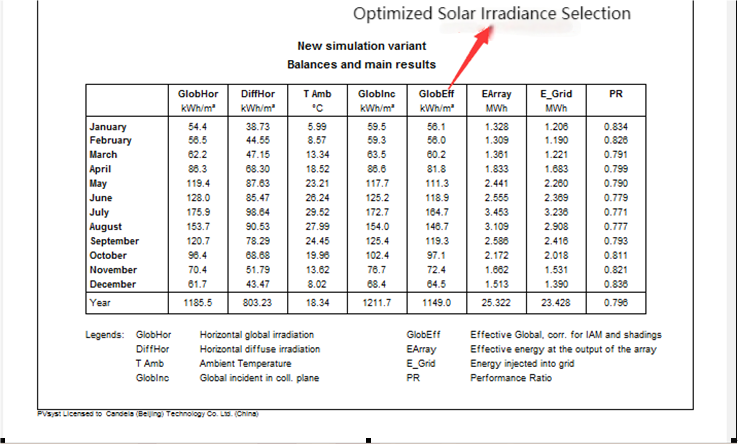
3. Question: Regarding the irradiation amount of fixed supports in the project, the measured results in some areas show that the irradiation amount without shadows from 9 o'clock to 15 o'clock will be less than the horizontal irradiation amount.
▲Figure 7
[Answer from Teacher Chen]: The radiation amount on the photovoltaic plane, GlobInc, is generally affected by three loss factors: shading loss (ShdLoss), relative transmittance loss (IAMLoss), and dust loss (SlgLoss). The effective radiation amount that ultimately reaches the interior of the PV module is GlobEff, where GlobEff = GlobSlg = GlobInc - ShdLoss - IAMLoss. If the installation inclination of the PV module is small and the three losses have a significant impact, GlobEff may be less than GlobHor.
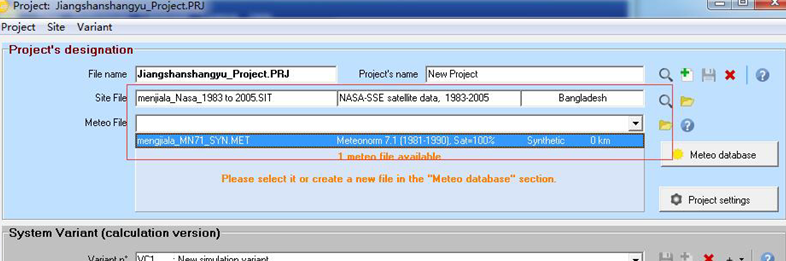
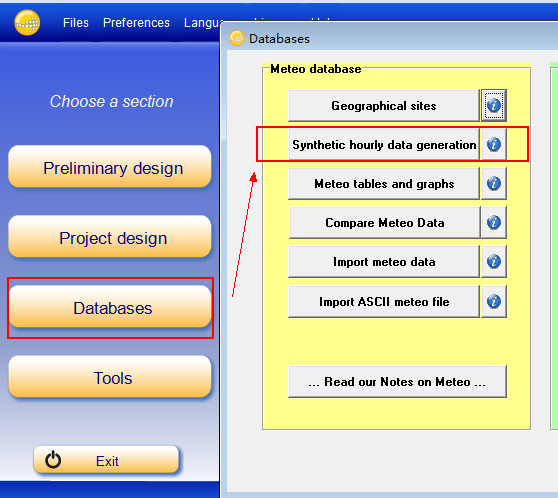
4. Question: When using NASA data to calculate radiation exposure, I cannot select NASA data. What is the reason for this?
▲Figure 8
[Teacher Chen's answer]: The situation shown in the figure occurs because the imported NASA meteorology data has not automatically generated hourly meteorology data. After importing NASA monthly meteorology data each time, you need to open the "Database" to generate hourly meteorology data, as shown in the figure below.
▲Figure 9
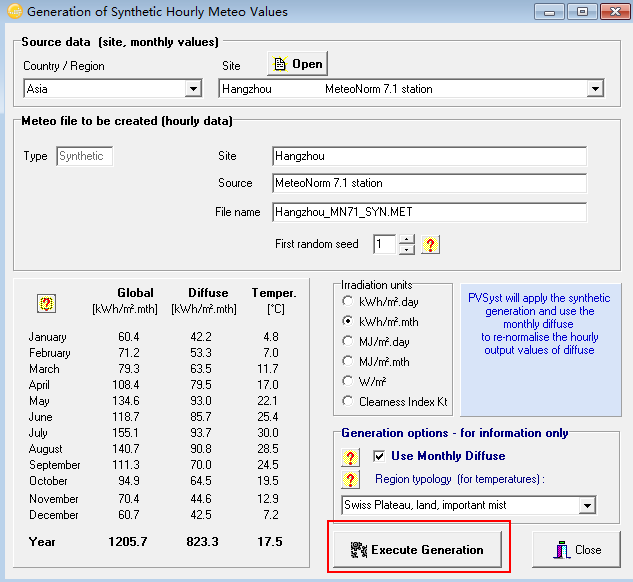
▲Figure 10
Article Comments(0)