The PVsyst version used for the following Q&A is version 6.66, and other versions can be referenced for guidance.
1. How to interpret the shadow animation trajectory on the PVsyst 3D simulation interface? How to simulate at a specific solar hour?
[Teacher Chen's answer]: Currently, the simulation of 3D shadow animation in PVsyst versions 6.66 or 6.67 differs from previous versions, as there is no option to simulate according to "Solar time" or "Legal time". In the current version, the default setting is to simulate according to "Legal Time", which, in China, corresponds to Beijing time. As shown in Figure 1, a rectangular obstacle is placed about 1 meter away from the center of the front row of photovoltaic arrays. According to previous versions, if simulated according to solar time, the shadow curve would be symmetrical. However, it is not symmetrical under solar time.
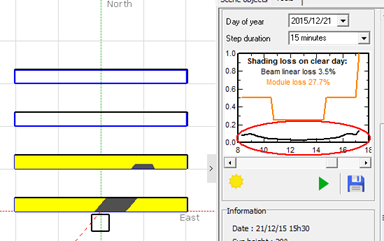
▲Figure 1
According to the "Photovoltaic Design Code", from 9 a.m. to 3 p.m. on the Winter Solstice, there should be no shadow blocking the front, back, left, and right sides of the arrays. Note that the time mentioned here is solar time. If we want to confirm whether the spacing between the front, back, left, and right sides of the array arrangement meets the design specifications through PVsyst, we need to verify it under solar time. So, how exactly should we do it?
1) Firstly, we need to transform the local solar time at 9 hours or 15 hours into Legal time. The formula is as follows:
Legal time = Mean solar time + 4 minutes/degree × (120 degrees - local longitude)
Solar time = Mean solar time + True mean solar time difference = Legal time - 4 minutes/degree × (120 degrees - local longitude) + True mean time difference.
The true solar time difference is solely related to the date and is independent of the location of the region. It can be found online that on the Winter Solstice, the true solar time difference is 1 minute and 22 seconds at 9 o'clock.
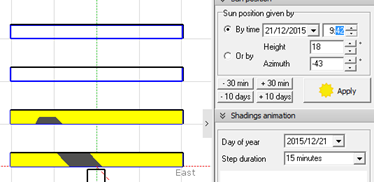
For example, in Xi'an, with a longitude of 108.93 degrees, the Legal time corresponding to 9:00 hours solar time is 9:42:55, and the Legal time corresponding to 15:00 hours solar time is 15:42:55.
2) Secondly, in the "Sun position" section of the PVsyst 3D simulation interface, select Winter Solstice, and set the Legal time to 9:42.
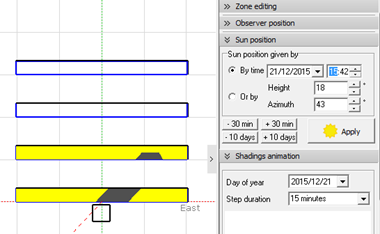
As shown in Figure 2, the shadow simulation results can be used to determine whether the current Pitch causes shadow obstruction to the rear array at 9 o'clock or 15 o'clock in the solar day. If there is shadow obstruction, the Pitch can be increased.
▲Figure 2
▲Figure 3
2. How to import the PAN file of PV modules into PVsyst?
[Answer from Teacher Chen]: After the PAN file for the PV module is created, the general steps to follow are as follows: As shown in Figure 4, open the menu bar of the software, click "File", select "Import components", and the interface will be displayed as shown in Figure 5.
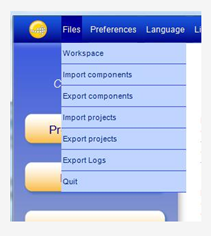
▲Figure 4
Place the Pan file on the desktop, click the "Browse" button in Figure 5 to browse the desktop, and then click "Confirm". Gradually click the plus sign (+) button on the left side of the Figure 5 interface to locate the Pan file you want to import, and then click with the mouse. The "import" button on the interface will change from a gray, non-operational state to an operable state, and you can click to import.
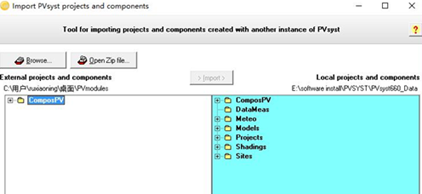
▲Figure 5
3. Can the voltage temperature coefficient of PV modules be entered in PVsyst?
[Answer from Teacher Chen]: PVsyst has two internal voltage temperature coefficients. One is generated by PVsyst based on its inherent Model, and the other is the actual Data from the PV module's Datasheet. During actual simulation, users can choose one of them. Figure 6 shows the interface after opening a certain PVsyst PV module. In the "Additional Data" → "Secondary Parameters" section, you can see "Specified muVoc", which is the actual Data from the PV module's Datasheet and can be modified by the user.
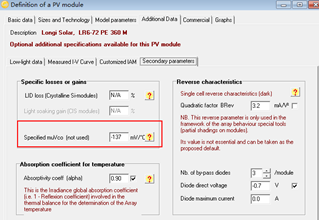
▲Figure 6
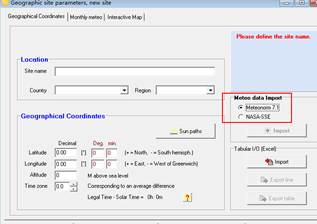
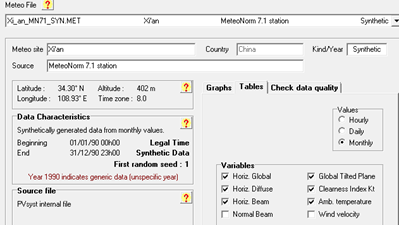
4. When creating a new meteorological station, the PVsyst interface remains unresponsive for a long time. How can this be resolved?
[Answer from Teacher Chen]: Due to the blocking of Google Maps, when creating a new meteorological station, you can try unplugging the network cable, then opening the interface shown in Figure 7 and quickly clicking the mouse to switch to the "Geographical Coordinates" tab. Enter the corresponding longitude, latitude, altitude, and time zone, and on the right side, you can import the meteorological data for that location from Meteonorm or NASA.
▲Figure 7
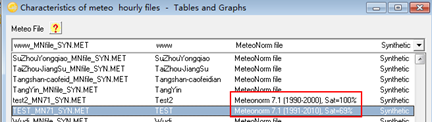
5. What does "Sat=40%" mean?
[Teacher Jiang's answer]: As shown in Figure 8, the Data source annotation is "Meteonorm 7.1 (1991-2000), Sat=69%". This value indicates that the meteorological Data for this Project site utilizes both ground and satellite Data, with the satellite Data having a weighted proportion of 69%.
▲Figure 8
6. Can PVsyst query the total radiation, direct radiation, and diffuse radiation at the project site?
[Teacher Chen's answer]: Open a certain meteorological station, as shown in Figure 9. Click on the "Tables" tab, select "Display by Month", and in the variable category, check the six items as shown in Figure 6. Click on the "Tables" at the bottom to query the meteorological data of the project site, as shown in Figure 10.
▲Figure 9
In Figure 10, starting from the first array, the total radiation on the horizontal plane, scattered radiation on the horizontal plane, direct radiation on the horizontal plane, total radiation on the photovoltaic plane, clear sky coefficient, and ambient temperature are represented for each month.
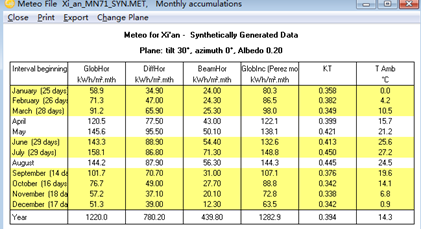
▲Figure 10
Tip: Interested readers can refer to past articles to search for issues encountered while using PVsyst.
Article Comments(0)